


Carnival Business Links Volume 2 Issue 2 April 2016
How Much Do Carnival Visitors Spend?
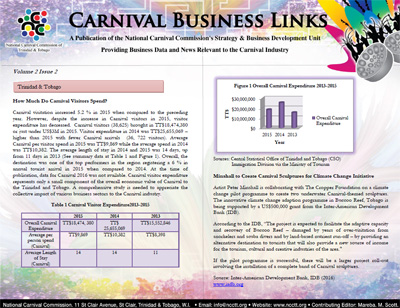
Carnival visitation increased 5.2 % in 2015 when compared to the preceding year. However, despite the increase in Carnival visitors in 2015, visitor expenditure has decreased. Carnival visitors (38,625) brought in TT$18,474,380 or just under US$3M in 2015. Visitor expenditure in 2014 was TT$25,655,069 – higher than 2015 with fewer Carnival arrivals (36, 722 visitors).
Average Carnival per visitor spend in 2015 was TT$9,869 while the average spend in 2014 was TT$10,382. The average length of stay in 2014 and 2015 was 14 days, up from 11 days in 2013 (See summary data at Table 1 and Figure 1). Overall, the destination was one of the top performers in the region registering a 6 % in annual tourist arrival in 2015 when compared to 2014.
At the time of publication, data for Carnival 2016 was not available. Carnival visitor expenditure represents only a small component of the overall economic value of Carnival to the Trinidad and Tobago. A comprehensive study is needed to appreciate the collective impact of various business sectors to the Carnival industry.